Screenshots

Stand-alone web interface

LabPal can run in stand-alone mode; it provides a friendly user interface to control experiments and view their results in a local web browser.

Click to view full size image
The list of experiments. Each experiment can be individually queued, and its current status is shown with an icon.
Screenshot
A table created by fetching parameters from a set of experiments. The table is dynamically updated when running experiments produce new data points.
Screenshot
Various plots created by associating them to data tables. Each plot can be exported in various formats, including PDF and GnuPlot. The plots can also be exported as a multi-page PDF bundle.
Screenshot
Tables are interactive. Clicking on a cell displays the provenance tree of this value.
Screenshot
A provenance tree, which shows how an individual data point (bottom) is computed from intermediate values. This tree is interactive; clicking on a node brings the user to the experiment or table containing a particular value.
Screenshot
A cell in a table is highlighted after clicking on the corresponding node in a provenance tree.
Screenshot
Data points can be traced back all the way to the individual experiment instance that produced each value contributing to the result.
Screenshot
Tables can be exported to LaTeX. The resulting PDF keeps its interactive hyperlinks on table cells leading to the provenance tree of each cell.

Code Ocean integration

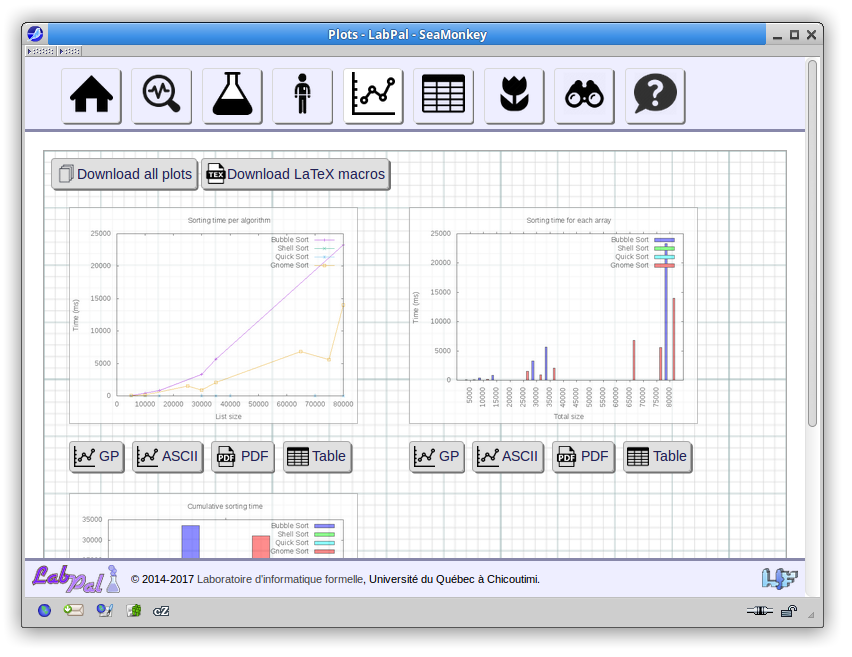
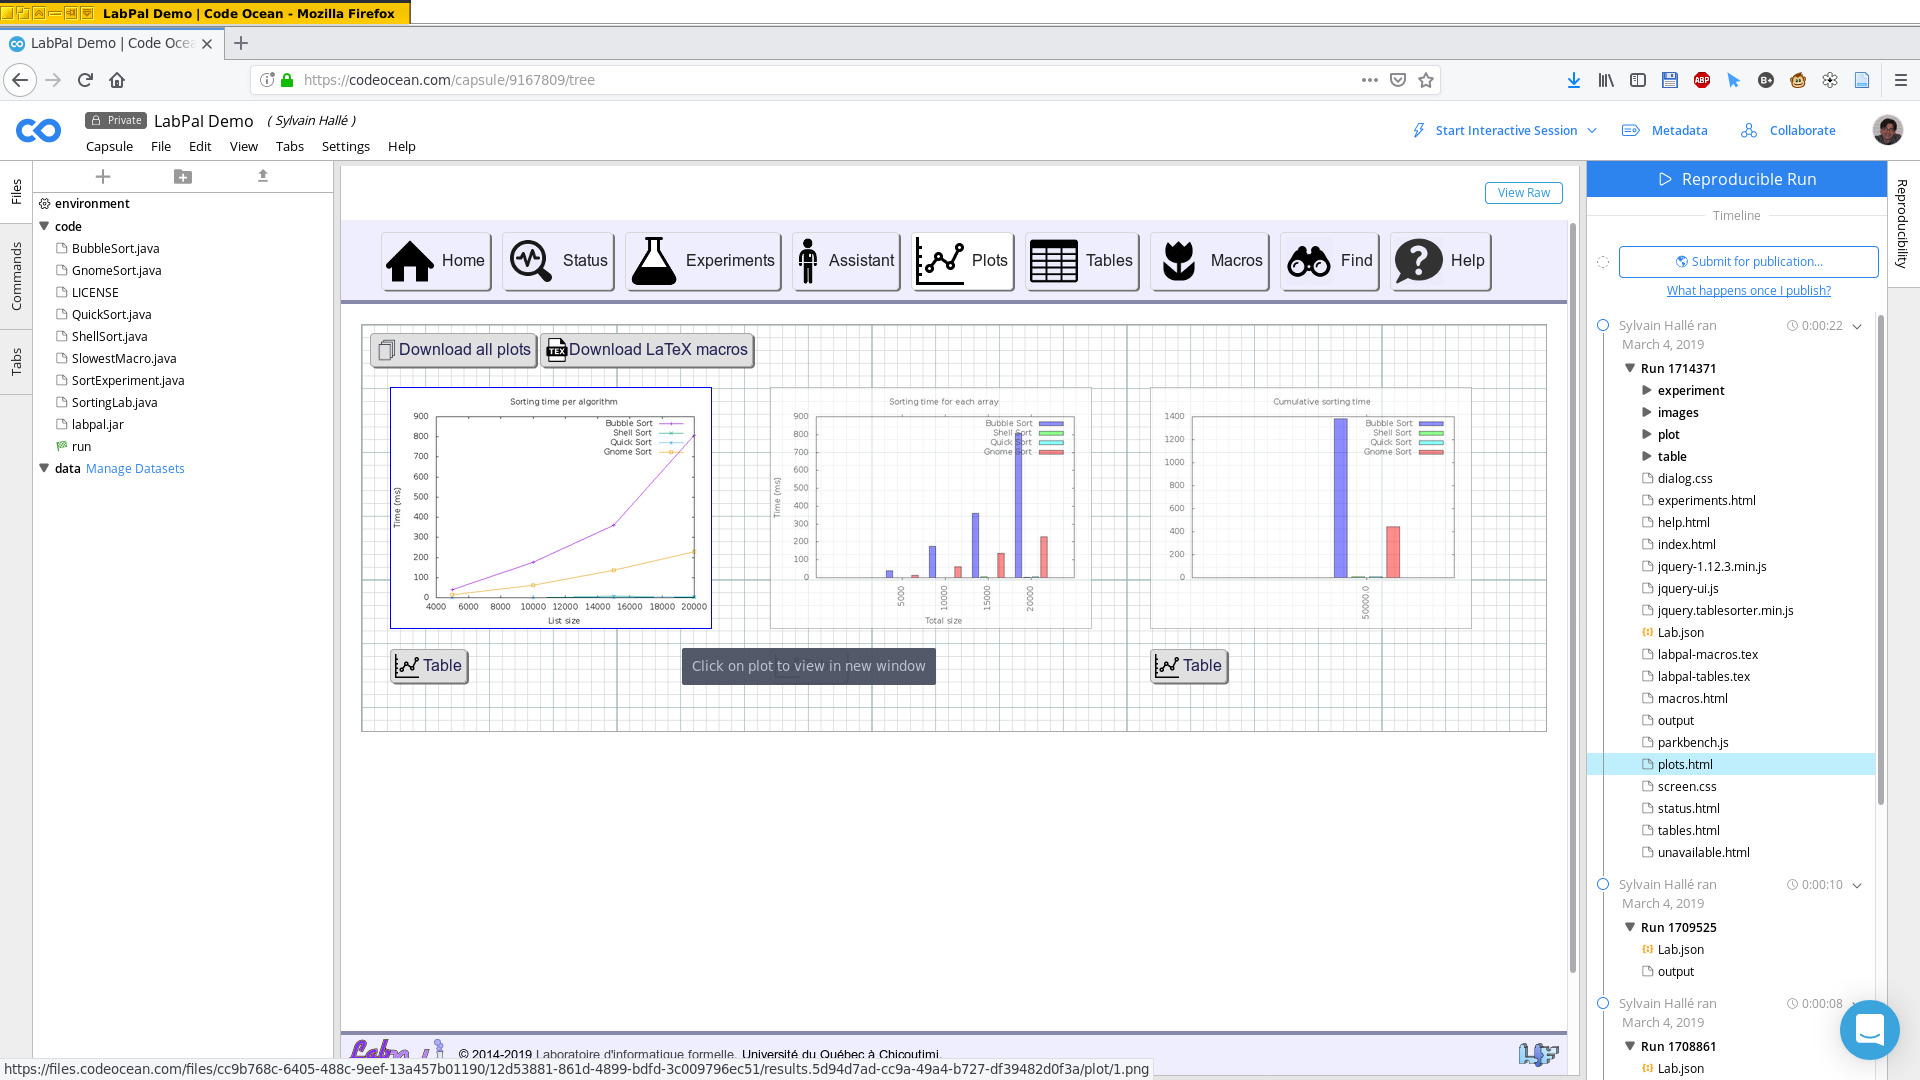
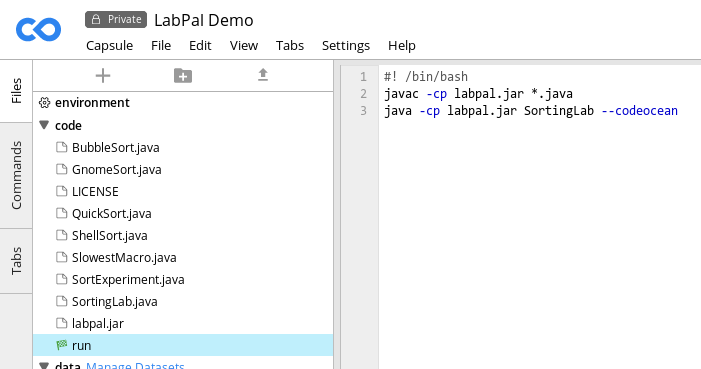
LabPal can also run inside the Code Ocean platform. When run in batch mode, all experiments are executed and the plots, tables and other files are exported to a results folder that can be browsed interactively using a static version of the web interface.

Screenshot
The plots produced by LabPal, viewed inside the Code Ocean interface.
Screenshot
A provenance tree produced by LabPal, viewed inside the Code Ocean interface. As in the stand-alone interface, nodes in this tree are clickable.
Screenshot
Running LabPal within Code Ocean is as simple as writing a two-line start script.