In 1,800 words and 30 lines of code, let us learn how LabPal works and what you can do with it.
Let us measure empirically how long it takes to sort an array using the Gnome Sort algorithm for various array sizes. We will use LabPal to prepare a set of experiments that will do this.
In a folder of your choice, simply download and unzip the project template that is available online. In order to compile the project, make sure that Ant is also installed. At the root of the project folder, type
$ ant download-deps
This will make sure that your project includes the latest version of the LabPal library (which will be placed in the dep subfolder).
Basic workflow
First, we have to understand the structure of LabPal, summarized in the figure below. Its basic building block is an experiment, which is an object that can take input parameters, can be run, and produces one or more output values. Typically, many experiment copies (or “instances”) are created, each with its own set of input parameters. There can even exist more than one type of experiment, and each type may expect different input parameters, perform different things when run, and produce different kinds of output parameters.
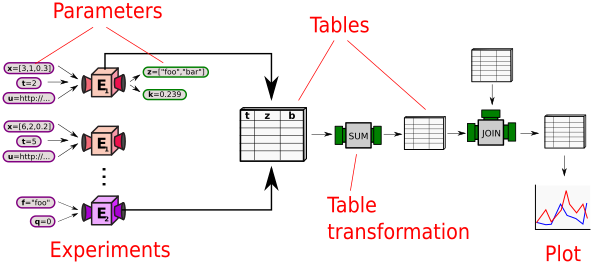
The results of experiments can be collected into tables, which are data structures that are populated by fetching values of specific parameters in a pool of experiments. Many tables can be created, each being associated to different sets of experiments or fetching different parameters. Tables can be transformed into other tables using operations called transformations. For example, a table can be transposed, two tables can be joined on a common parameter name (similar to an SQL join), the sum, average, or quartiles of a table’s columns can be calculated.
Finally, tables can be given as input to plots, which are graphical representations of a table’s content. By default, LabPal provides interchangeable connectors to two widely used plotting systems, GnuPlot and GRAL. A laboratory(or “lab” for short) is an organized and documented collection of experiments, tables and plots.
Creating an experiment
We first need to create an experiment. An experiment is an object that can take input parameters, can be run, and produces one or more output values. In LabPal, experiments all descend from the class Experiment. In our example:
- Our experiment will take a single input parameter, which is the size of the array we wish to sort. Setting an input parameter is done by calling the method
setInput, which associates to a parameter name a particular value. - When being run, the experiment will generate an array of given size and then sort it. This will be done in method
execute, which all experiments must implement. - Our experiment produces a single output value, which corresponds to the time it takes to sort that particular array. Writing an output value is done by calling the method
write, which associates to a name a particular value.
Therefore, a sensible way to create our experiment would be to write this:
  class GnomeSort extends Experiment {

  public GnomeSort(int n) {
    setInput("Size", n);
  }

  public void execute() {
    // Generate random array of given size
    Random rand = new Random();
    int n = readInt("Size");
    int[] array = new int[n];
    for (int i = 0; i
The constructor receives a number, and sets its as an input parameter of the experiment with name "Array size". Method execute first reads the input parameter (the number), generates an array of random values of desired size, and then sorts this array using Gnome sort. This last bit of code is surrounded by two calls to get the current system time. Finally, the duration of the sort operation is written as an output data and is given the name "Time".
Creating a lab
We are now ready to create a laboratory ("lab" for short), which will be the environment in which many of these experiments will be run. In LabPal, a lab is a descendent of the Laboratory class. The template project already contains an empty laboratory called MyLaboratory (for the moment, don't change its name). Experiments can be created in a method called setup, and are added to the lab by a call to method add. Our lab could hence look like this:
class MyLaboratory extends Laboratory {

  public void setup() {
    add(new GnomeSort(10));
    add(new GnomeSort(100));
    add(new GnomeSort(1000));
  }

  public static void main(String[] args) {
    initialize(args, SortingLab.class);
  }
}
This lab creates three instance of our GnomeSort experiment with three different array sizes, and adds them to the lab. The main method is only there so that our lab can be executable from the command line. Normally, all it requires is to call initialize with the command line arguments and the class of the current lab. You do not need to write anything else there.
Running the lab
That's it! At the root of your project, simply type ant; this will compile your lab and produce a JAR file called my-lab.jar.
This JAR is runnable and stand-alone: you can move it around without needing to worry about installed libraries and other dependencies. You can then start the lab by simply running the JAR file:
$ java -jar my-lab.jar
You should see something like this:
LabPal v2.11.1 - A versatile environment for running experiments
(C) 2014-2019 Laboratoire d'informatique formelle
Université du Québec à Chicoutimi, Canada
Visit http://localhost:21212/index in your browser
Hit Ctrl+C in this window to stop
This tells you that LabPal is started, and that you can use its web console by typing the URL http://localhost:21212/index in your web browser. Here is a screenshot of one of the typical pages of the console:
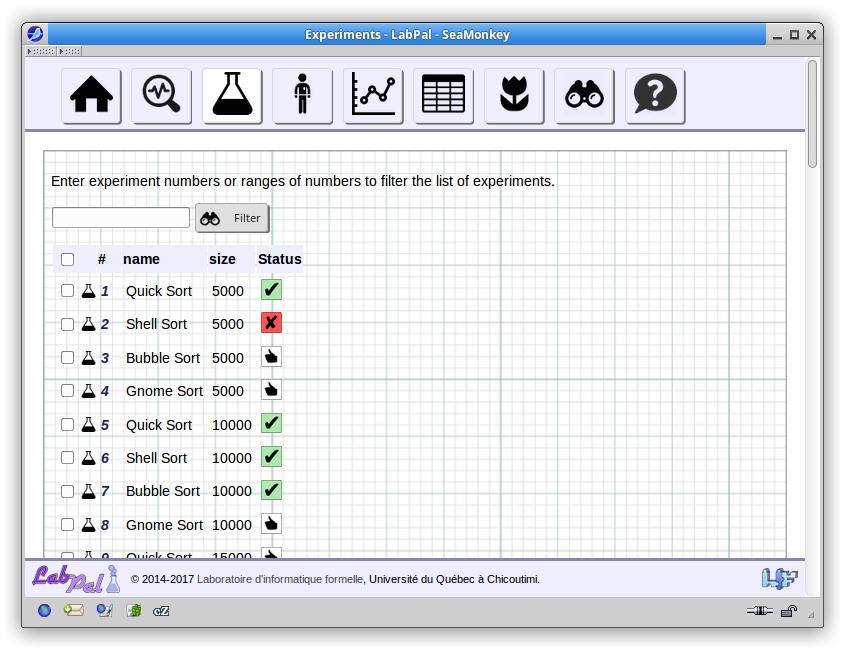
From then on, you can use this console to control the execution of your experiments and see the results they produce. For more information, see Using the web console.
Adding a table
So far, our lab contains three experiments, each of which computes and generates a single output data element, namely the duration of the sorting operation. These can be viewed by clicking on each of the experiments in the web console. Let us now collect these results and display them.
To do so, we need to create a Table. A table is a collection of table entries, each of which is a set of key-value pairs. We would like to create a table from the results produced by our experiments: each entry should contain the Size of the array and the Time it took to sort it. This is done by creating a new ExperimentTable --that is, a table whose content is fetched from the data produced by one or more experiments. (In contrast, a DataTable is a table made of hard values that you enter by yourself.) We create the table by telling it the names of the parameters we wish to fetch from the experiments:
ExperimentTable t = new ExperimentTable("Size", "Duration");
add(t);
If we want the table to show up in the lab console, we must also add it to the lab by calling add. Once the table is created, experiments must be added to it. We can do this in two ways:
By calling the
addmethod on this table, and passing it the experiments we whish to add one by one.By passing the table to the
addmethod we already used to add the experiments to the lab. The experiment will be added to the lab and to the table at the same time.
Let us use the second technique. Our setup method will now look like this:
public void setup() {
  ExperimentTable t = new ExperimentTable("Size", "Duration");
  add(t);
  add(new GnomeSort(10), t);
  add(new GnomeSort(100), t);
  add(new GnomeSort(1000), t);
}
If you recompile and run this new lab, you will now see that a table shows up in the Tables page in the web console, with the name "Table 1". Clicking on it will show something like this:
| Size | Duration |
|---|---|
| 10 | |
| 100 | |
| 1000 |
Each line of the table corresponds to the values fetched from one experiment we added to it. The Size parameter is filled, but the Duration column shows nothing. This is normal: since we haven't run any experiment, these data elements have not yet been produced.
A table is a dynamic structure. If you run one of the experiments and go back to the table, you will see that the corresponding cell now has a value. As a matter of fact, when you run a lot of experiments, you can periodically refresh a table's page and see the cells being filled with data progressively.
The table can be exported in various ways:
- You can copy-paste its contents in your word processor; this should normally preserve its formatting.
- In the Tables page, you can click on one of the icons to download the table as an HTML, plain-text (CSV) or LaTeX file you can include, for example, in a resarch paper you are writing.
Adding a plot
It is sometimes better to display data graphically, so let's new add a Plot to our lab. A plot is always created with respect to an existing table. In our case, we would like to trace a line showing the sorting time with respect to the size of the array. The object we use for this is a Scatterplot, to which we pass the table we created earlier:
Scatterplot plot = new Scatterplot(t);
add(plot);
Again, don't forget to add the plot to the lab, or it won't show up in the console.
That's it. By default, a scatterplot uses the first column of the table as the values for the x axis, and any remaining columns as data series for the y value.
If you recompile and restart the lab, you will now see a plot in the Plots page, called "Plot 1". If you run the experiments, you will see the plot being filled with data. Since the plot is created from a table, its contents are dynamically updated every time you refresh the page.
As for tables, you can choose to save the plot as a PNG image (by clicking on it and using the Save menu in your browser), or to export it as a PDF file you can include e.g. in a paper you are writing.
Wrapping up
Obviously, we don't need to create experiments one by one; we can use loops and other constructs to add them in batch to a lab. Instead of just three data points, we will use a loop to create 10 experiments with various array sizes.
Let us look at our setup method one last time:
  public void setup() {
  // Create table
  ExperimentTable t = new ExperimentTable("Size", "Duration");
  add(t);
  // Create experiments
  for (int size = 100; size
All done! We now have a basic running laboratory with:
- An auto-generated table (exportable in various formats)
- An auto-generated line plot (exportable in various formats)
- A web interface to control the execution of the experiments, display the tables and show the plots
- An Ant script that can compile and bundle everything into a single, stand-alone, runnable JAR file
All this for about 30 lines of code. Not bad, considering the alternative: writing your own command-line scripts to run the experiments, generate and process text files to be piped into Gnuplot or some other piece of software, etc. Plus, it is very unlikely you'd spend time to make these scripts user-friendly, let alone interactive like LabPal's interface.
Advanced functionalities
In this quick tutorial, we've barely scratched the surface of what you can do with LabPal. If you are interested in knowing more, here are a few pointers.
- Learn how to create and customize plots
- Create, process and manage tables
- Document your lab for an external user by adding metadata to your experiments and their parameters
- Create more complex experiments that can generate auxiliary files, update a progress indicator, produce error messages, etc.
- Learn about provenance and traceability for your data